
How to choose what to automate first: a 3-factor scoring framework
Most automation projects fail at one step that no software can fix: choosing the wrong process to start with. The work ships, the workflow runs, and a year later nobody can point to the line on the P&L where the savings live.
The fix is not better software. It is a sharper way to decide what to automate first.
In our automation engagements at Automathing, we score every candidate process on three factors before a single integration is built: volume, time per execution, and business stakes. The top three almost always pay back the engagement within 90 days. Here is how the math works, and how you can run it yourself.
Why "automate everything" fails (and what to do instead)
If you ask any 10-person operations team to list what is wasting their time, you will get a list of 40 to 60 candidates within an hour. Every one of them is a real annoyance. Every one of them is a real problem.
That is the trap.
Without a scoring layer, teams default to two flawed heuristics:
- Loudest complaint wins. Whoever brings up the issue most often gets their workflow automated first, even when the math says the savings are small.
- Easiest project wins. The team picks the workflow that is simplest to wire up, which is rarely the workflow with the biggest payback.
Both heuristics burn budget on small wins and starve the projects that would actually change the cost structure of the business. A scoring framework forces the conversation back to math.
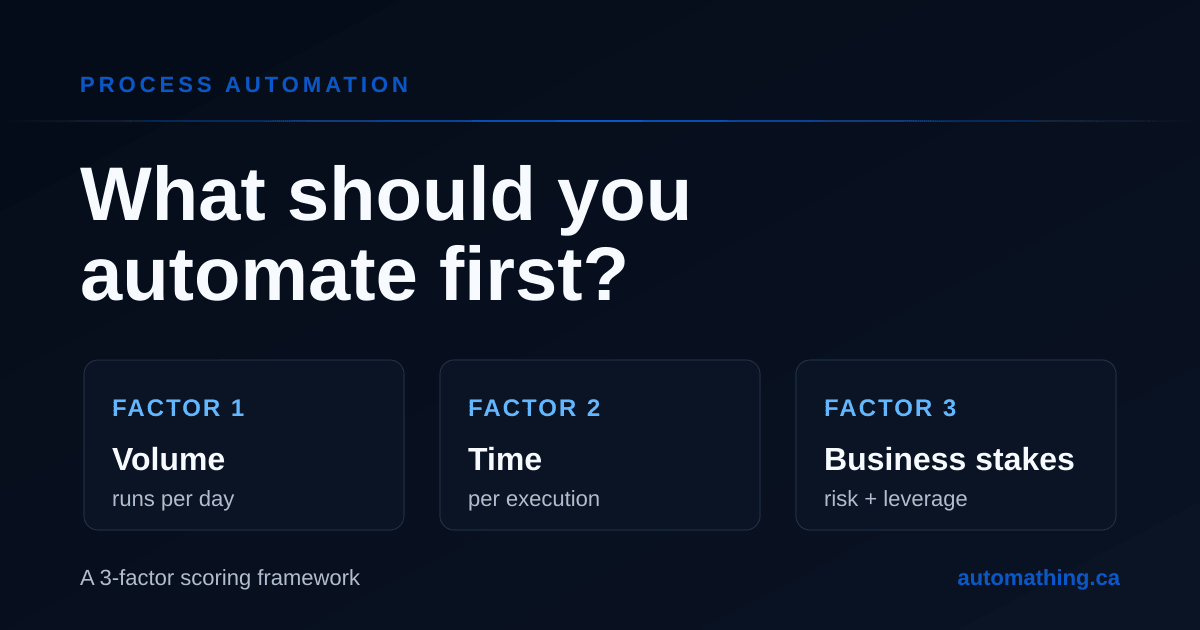
The 3-factor scoring framework for process automation
For each candidate process, capture three numbers.
Factor 1: Process volume (how often it runs)
How often does the process actually run? Per day for high-frequency work, per week for medium-frequency, per month for everything else. Use the same time unit across all candidates so the scores are comparable.
The most common mistake here is guessing instead of measuring. A process that "feels" daily often turns out to run twice a week. A process that "feels" rare often runs 30 times a day across different team members. Pull the data from your CRM, your support system, your inbox rules, or simply count for a week before scoring.
Factor 2: Time per execution (how long each run takes)
How long does one run take, end to end, including context switching? This is the second most-guessed number, and the one most often understated.
For workflows that span tools (open the CRM, copy the order, switch to the spreadsheet, update the status, send the confirmation email), the total realistic time is usually 2 to 3 times what the team reports. Use real measurements over a typical week, not "ideal" timings.
Factor 3: Business stakes (downside risk + strategic upside)
What does this process actually mean for the business? This factor has two sides that most scoring sheets miss.
Downside: error cost. What does it cost when the process is done wrong? Three components:
- Rework time. How long does it take to detect and undo the mistake?
- Downstream impact. Does the error cascade (wrong invoice, then wrong report, then wrong forecast)?
- Customer or compliance exposure. Does the error reach a customer or trigger a regulatory issue?
Upside: strategic multiplier. Most teams stop at error cost, which only captures avoided loss. But the same automation can also unlock revenue, improve customer experience, or remove a scaling bottleneck. Score that as a single multiplier:
| Multiplier | When to apply it |
|---|---|
| 1.0 | Pure back-office. Time savings are the only value (e.g. internal report consolidation). |
| 1.5 | Customer-facing or friction-reducing (e.g. order confirmation, status update). |
| 2.0 | Directly touches revenue (e.g. lead routing, quote generation, payment reminders). |
| 3.0 | Unlocks scaling or removes a planned hire (e.g. onboarding that was capping growth). |
Rule of thumb: if the process, automated, gains more than time (deals, NPS, growth capacity), it scores 1.5 or higher.
A process that runs 200 times a day but produces a $5 rework when it fails ranks below a process that runs 8 times a day but produces a $400 chargeback when it fails. Volume is not destiny. Business stakes (both sides) is the multiplier most teams miss.
The process automation scoring formula
For each candidate, the monthly score is:
Score ($) = (Time savings $ × Strategic multiplier) + Error cost avoided $
where:
Time savings $       = Volume × Time per execution × Loaded hourly rate
Error cost avoided $ = Volume × Error rate × Error cost per incident
The first term captures recurring time savings, weighted by strategic value. The second captures avoided risk. Convert both to dollars using a single fully loaded labour rate (we use $75 to $120 CAD per hour for most Quebec SMEs).
Rank candidates by score. The top three are your automation roadmap for the next quarter.
A worked example: scoring 3 SMB processes
Three candidate processes from a real SMB engagement, at a loaded rate of $90 per hour.
A. Daily invoice creation from completed jobs
- Volume: 22 invoices per day × 20 working days = 440 per month
- Time per execution: 4 minutes
- Error rate: 5 percent
- Error cost: $40 per incident (customer corrections, chargeback risk)
- Strategic multiplier: 2.0 (touches revenue: faster invoicing accelerates cash collection)
Time savings: 440 × 4 min × $90/hr = $2,640. Weighted: $2,640 × 2.0 = $5,280. Error avoided: 22 × $40 = $880. Monthly score: $6,160.
B. Weekly payroll spreadsheet consolidation
- Volume: 4 per month
- Time per execution: 90 minutes
- Error rate: 10 percent
- Error cost: $300 per incident (payroll disputes, late filings)
- Strategic multiplier: 1.0 (internal back-office, no customer or revenue upside)
Time savings: 4 × 90 min × $90/hr = $540. Weighted: $540 × 1.0 = $540. Error avoided: 4 × 10% × $300 = $120. Monthly score: $660.
C. New employee onboarding checklist
- Volume: 1.5 per month on average
- Time per execution: 180 minutes
- Error rate: 30 percent (steps missed)
- Error cost: $200 per incident (access delays, compliance gaps)
- Strategic multiplier: 1.5 (HR/customer-facing: faster ramp, fewer access incidents)
Time savings: 1.5 × 180 min × $90/hr = $405. Weighted: $405 × 1.5 = $608. Error avoided: 1.5 × 30% × $200 = $90. Monthly score: ~$698.
Without the strategic multiplier, the invoicing automation would have looked worth about $3,500 per month. With it, it is worth $6,160, almost ten times the next candidate. That is the project to ship first.
Common mistakes when prioritizing automation
Two patterns show up in nearly every workshop we run.
Stacking the wrong "obvious" candidates. Teams pile their three top candidates from the same department because that is where complaints are loudest. The math usually shows that the top three live in three different departments, because the highest-volume work is rarely the noisiest.
Skipping business stakes entirely. A scoring sheet with only volume and time picks the wrong projects whenever a low-frequency process produces large downstream errors, or whenever a high-frequency process happens to sit on the revenue path. Always price both sides explicitly (error cost AND strategic multiplier), even when the numbers are rough estimates. A rough estimate beats no estimate.
Why process automation pays back in 90 days
When the top-scored processes are automated correctly, the engagement pays itself back within 90 days because of three compounding effects.
- Time savings start immediately. The first invoice automated saves the same 4 minutes the 440th invoice will save. There is no ramp-up.
- Error cost drops as soon as the process is consistent. Most automation work doubles as a rewrite of the process, so error rates fall before the integration even goes live.
- The freed time is reusable. The 29 hours per month you save on invoicing do not vanish. Those hours pay for the next automation, or for the strategic work the team was always supposed to be doing.
Across our automation engagements, the top three projects scored this way generate enough value within the first quarter to fund the entire roadmap for the rest of the year.
Free process automation scoring template
Run this in a spreadsheet before any tool selection happens:
| Process | Volume / mo | Time / run (min) | Error rate | Error cost ($) | Strategic mult. | Monthly score ($) |
|---|---|---|---|---|---|---|
| A (invoicing) | 440 | 4 | 5% | 40 | 2.0 | 6,160 |
| B (payroll consol.) | 4 | 90 | 10% | 300 | 1.0 | 660 |
| C (onboarding) | 1.5 | 180 | 30% | 200 | 1.5 | 698 |
The strategic multiplier column is the one most teams forget. Keep it explicit so the conversation stays honest: every process either does or does not touch revenue, customer experience, or scaling.
Once the scores are in, the conversation changes. You stop debating whose complaint matters most and start ranking by dollar impact.
Next steps: from scoring to shipping
Scoring is step one. Once you know which processes belong in the first wave, two questions follow: which automation tool to use, and how to wire it without breaking the rest of your stack.
We cover the tool-selection part in our process automation service page, and the broader Quebec SME automation context (including funding programs) in Automating Your SME's Processes in Quebec.
If you want to skip the spreadsheet and have us run the scoring on your processes with you, book a free discovery call. We will leave you with the prioritized list whether or not you decide to work with us.